
You broke your wrist in a crash last week, and the emergency room bill is already bigger than a month of rent. You type your numbers into an accident settlement calculator and hope it will tell you what the claim is worth. The honest answer is a range built from documents you can point to, not one figure an insurer has agreed to pay.
That range only helps if you read it in layers. A gross total of medical bills, wages, and pain is the starting line. Fault, coverage, liens, and fees can cut it down before any money reaches you. The sections below walk through each input in order, show where the math breaks, and end at the net figure you should compare with an offer.
What an Accident Settlement Calculator Actually Estimates
Say the wrist is in a cast, you missed two weeks of work, and the calculator asks for bills, wages, and how bad the injury feels. It then adds those categories. It does not look up your file, call the adjuster, or guess what a jury would do.
Treat it like a weather forecast built from inputs. Temperature, wind, and humidity produce a likely range, not a promise of sunshine. Paid bills, missed pay, and how long treatment lasts produce a likely range of loss. Each category follows its own logic, so one multiplier pasted on top of the hospital bill hides the parts that are receipts and the parts that are judgments.
The tool also cannot see the insurer's internal valuation. It does not know whether a witness supports you, whether a prior injury is in the chart, or whether the policy is small.
Trial history is a poor substitute for that missing file. The Bureau of Justice Statistics reported a median award of $181,000 for personal-injury tort trials in U.S. district courts during fiscal years 2002–2003, and a median of $321,000 for property-damage trials. Those are old judgments in cases that reached trial, not today's negotiated settlements.
A usable estimate keeps three splits on the page: economic damages versus noneconomic damages, trial verdicts versus negotiated settlements, and injury claims versus property-only claims. Fault, severity, insurance, and proof can move every one of those lines.
Economic and Noneconomic Damages Explained
Economic damages are the receipts. Noneconomic damages are the cost of a changed life, and that cost has no receipt.
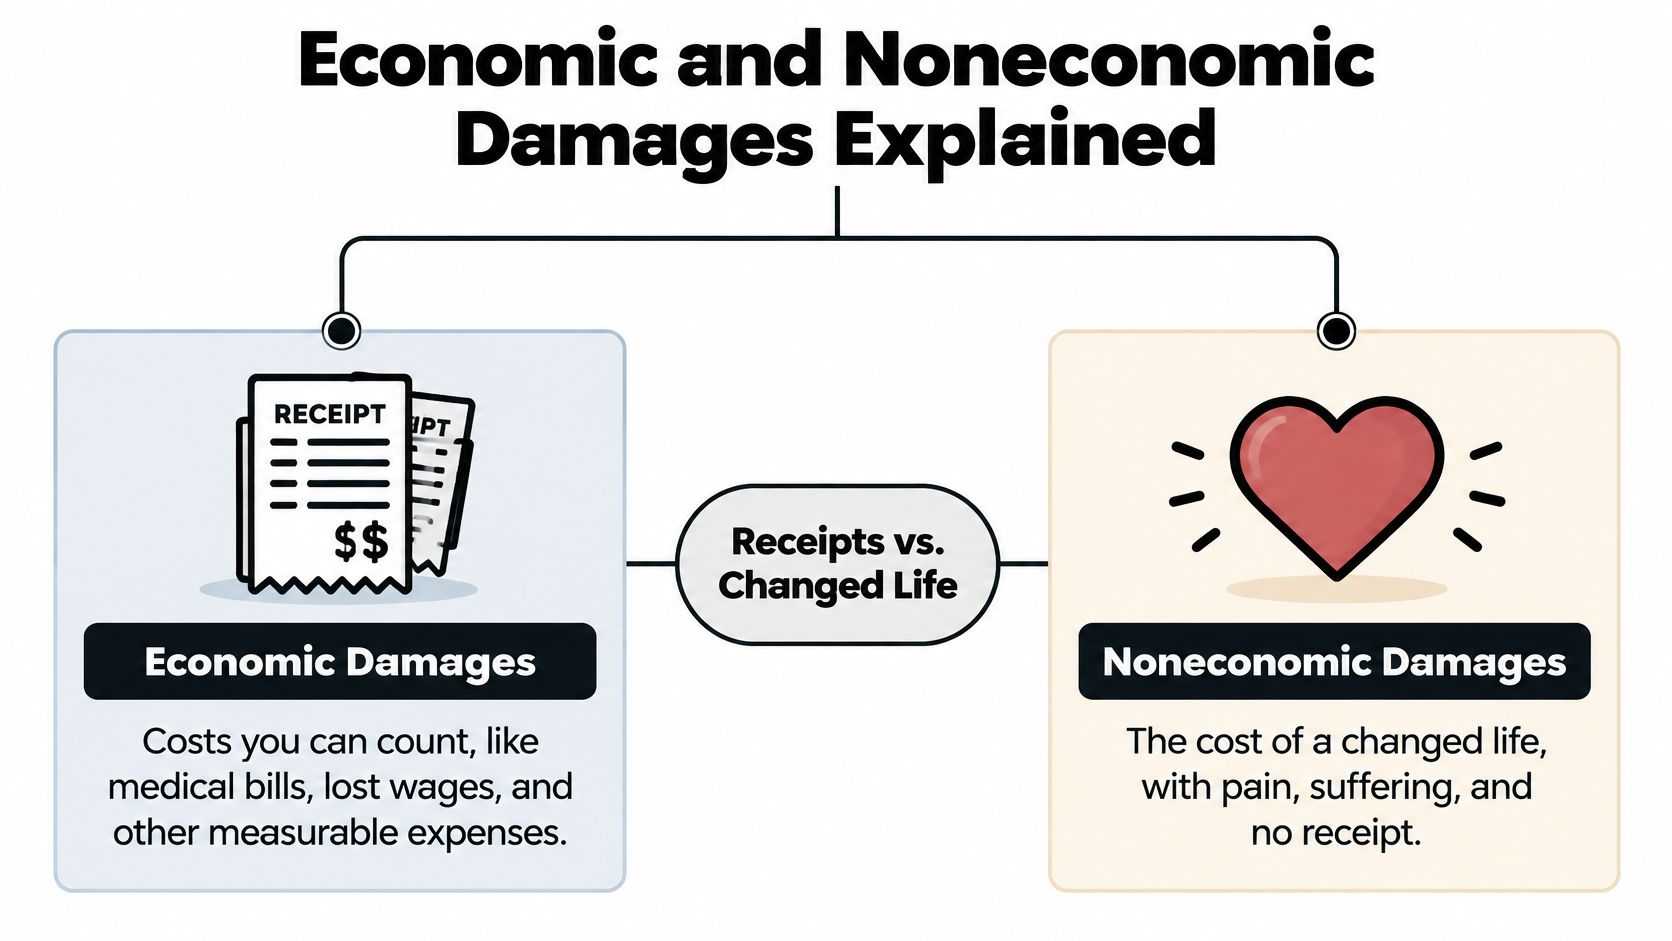
California's Judicial Council civil jury instructions put medical expenses, lost earnings, and future losses on the economic side. On the other side they list physical pain, emotional distress, disability, disfigurement, impaired enjoyment of life, and susceptibility to future harm. A calculator that multiplies one medical total by a single number buries that split.
Past losses versus future losses
Past losses are amounts you can already document. The paid portion of a bill, the balance still owed, and the paychecks you missed belong here. Future losses need assumptions: how long treatment continues, how many working years are affected, and how a future dollar is discounted to today's value. If the doctor has not said you are at maximum medical improvement, those future lines are still moving.
Noneconomic ranges are judgments tied to severity, duration, and written limits on what you can do. A short course of therapy for a sprain supports a narrower range than a surgery with lasting work restrictions. Our guide on how pain and suffering is calculated walks through why that range is argued, not looked up.
A calculator is only trustworthy when it shows which numbers are receipts and which are judgments.
Before you compare two estimates, label every figure as past or future, and as economic or noneconomic. If a tool will not let you see those labels, do not treat its total as a case value. Recoverability still depends on the state, liability, causation, comparative fault, the evidence, policy limits, and whether treatment has leveled off.
Inputs to Enter and How to Run the Estimate
Suppose the first number you type is the hospital's billed charge, the full sticker price before adjustments. The calculator accepts it, the total jumps, and every line after it rests on a figure nobody paid. That one choice is why the same crash can produce two very different estimates. Enter the questions in the order the tool asks them, and attach a document to each line. Start with what was paid and what is still owed. Adjustments, insurer payments, and liens change that medical line before any pain range is added.
| Input | What to Enter | Document That Supports It |
|---|---|---|
| Medical bills | Amounts actually paid and still owed | Itemized bills and explanation-of-benefits forms |
| Future treatment | Projected visits, procedures and cost | Physician treatment plan |
| Lost wages | Days missed and pay lost | Employer letter and pay stubs |
| Reduced earning capacity | Hours or income permanently lost | Work restrictions and vocational report |
| Injury duration | Months from crash to maximum medical improvement | Medical records with dates |
| Property damage | Repair cost or vehicle value loss | Repair estimate or valuation report |
| Fault share | Percentage the other driver is responsible | Police report and witness statements |
Injury duration starts on the crash date and ends when a doctor says you have reached maximum medical improvement, not when you feel mostly better. Property damage stays on its own row so it does not inflate the injury total. If a field asks for a future number and you only have a verbal estimate, mark it as provisional and keep the document that supports it.
If wage math is the hard part, use a separate walkthrough of how to calculate lost wages before you type a number from memory.
Seven steps from documents to a net range
- Total past medical bills net of payments and adjustments. Add what insurers and you have paid, plus balances still open. A forgiven or adjusted charge is not a receipt. Counting it as still owed overstates the medical pile.
- Add documented lost wages. Use pay stubs and an employer letter. Memory drifts, especially with overtime and tips.
- Project future care in three versions. Take the physician's written plan and build a conservative, an expected, and an adverse version. One rosy printout is not a forecast. If the plan says "as needed," write down the trigger and the cost of one visit.
- Estimate reduced earning capacity from the restriction you can prove. Use the work note or vocational report. The restriction is the input. The lost income is the output.
- Assign a noneconomic range and write down why. Tie the low and high ends to severity and to months of limits. A range you cannot explain with a record is a guess, and guesses widen the spread.
- Apply the fault share to the combined total. Skipping this step turns a clean arithmetic result into an overstatement. If the state bars recovery above a fault threshold, check that rule before you trust the total.
- Apply coverage limits and known deductions. Policy caps, health-plan reimbursement, and fees turn a gross range into a net figure. The first total on the screen is not the number you keep.
Read the three scenarios side by side. A wide spread means one assumption is driving the result. That assumption needs a document. A missing record marks the estimate as provisional. Do not round the gap upward to make the page look finished. Treat the estimate in layers: receipts first, then judgments, then the deductions that decide what reaches you.
How Severity, Fault and Treatment Gaps Shift the Estimate
Severity changes the whole model, not one extra line for pain. The photo below shows the kind of desk where this work happens: bills on one side, the calculator on the other.

National crash-cost totals are not your claim. NHTSA reports that U.S. motor-vehicle crashes in 2019 produced approximately $340 billion in societal costs, and that economic costs are roughly 14–18% of total costs for more serious nonfatal injuries and 43% for minor injuries. That swing is why severity should drive treatment length, impairment, the chance of future care, and the width of a noneconomic range, while your own bills stay on a separate ledger.
Fault usually works as a proportional cut. In many states a 20% share means you keep 80% of the damages. Some states bar recovery once your share passes a set threshold, so check that rule before you assume a percentage still leaves a check.
A long pause between visits can lower the estimate and gives an adjuster a causation argument: the gap, not the crash, explains the later pain. An updated prognosis moves the adverse scenario. If the specialist now expects surgery, the future-care line and the pain range both widen, and the old printout is stale.
| Factor | Effect on the Estimate | What to Check |
|---|---|---|
| Comparative fault | Reduces recovery in proportion to your share, or bars it above a state threshold | Police report and witness accounts |
| Injury severity | Widens or narrows future-care and pain ranges | Specialist notes and imaging results |
| Treatment gaps | Can lower the estimate and invite a causation dispute | Appointment records with dates |
| Prognosis changes | Shifts the expected and adverse scenarios | Updated physician opinion |
| Pre-existing condition | Can limit the portion attributed to the crash | Prior medical records |
Run one sensitivity test. Add a single month of projected treatment and see how far the total moves. If that one assumption swings a large share of the result, document it before you trust the page. A short video on reading these moving parts is worth watching once the table is in front of you.
Property Damage and Total Loss Stay Separate
A totaled car does not automatically raise the injury figure. The vehicle claim has its own valuation logic, and a bodily-injury calculator that folds the car into the medical total will be badly wrong.
J.D. Power's 2025 U.S. Auto Claims Satisfaction Study found that total-loss claims rose to 27% of claims, up from 24% in 2024 and 16% in 2022. Only 58% of customers said the total-loss valuation fully met expectations. Dispute is common, and it is a property dispute.
Prepare for these fights before you accept a vehicle number:
- Actual cash value: The offer is what the car was worth just before the crash, not what you paid or what a replacement feels like.
- Comparable vehicles: Listings of similar cars, with mileage and options, are the evidence. A single online average is not.
- Lender payoff gap: If the loan balance is higher than the value, that difference is not an injury damage.
- Rental-car timing: Rental days end on the insurer's schedule, often before you have another car.
- Salvage deductions: Keeping the wreck usually reduces the payout.
Newer electric cars and vehicles packed with safety technology are harder to compare. Repairability and parts can make a generic calculator's property box misleading. Property talks can happen alongside the injury claim, but they do not raise it, because the two losses are valued apart.
Collect a valuation report, pre-crash photos, maintenance records, and comparable listings. The calculator should show vehicle value on its own line so you can see what the injury figure does not include.
Why Gross Estimates Shrink to Net Recovery
A calculator's gross figure is the top line of a payslip. Everything that decides what lands in your account sits underneath it, and each layer removes money for a different reason.
Take a hypothetical file with $60,000 in gross damages, past bills plus a documented projection. A 20% fault share cuts that to $48,000. The at-fault driver's policy limit is $30,000, so payment stops there even though the damages math runs higher. A $6,000 health-insurance lien then comes out of that capped recovery, leaving $24,000 before attorney fees and case costs.
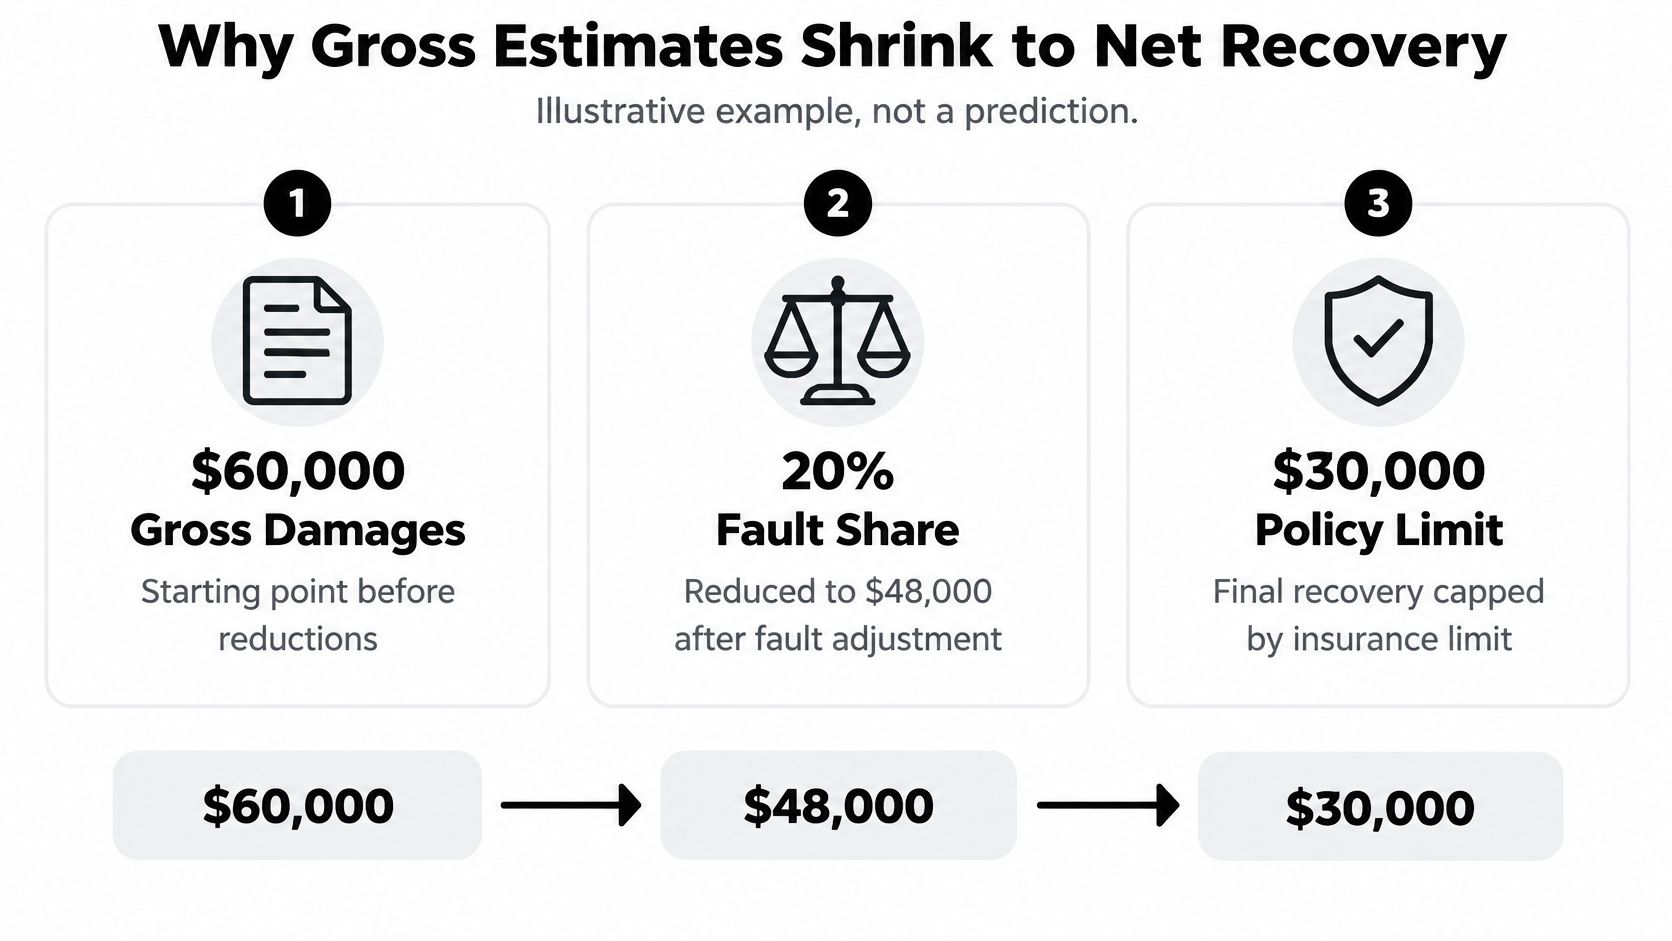
| Layer | Hypothetical Amount | Why It Changes |
|---|---|---|
| Gross damages | $60,000 | Documented past and projected losses |
| After 20 percent fault reduction | $48,000 | Recovery shrinks by the claimant's fault share |
| Policy limit applied | $30,000 | Coverage caps what the insurer will pay |
| Health-insurance lien | $6,000 | The health plan seeks repayment from the recovery |
| Estimated net recovery | $24,000 | What remains before attorney fees and case costs |
Each row answers a separate question. Fault asks who shares blame. The policy limit asks how much coverage exists. The lien asks who else has a claim on the money. They are not settled in the same conversation, which is why a single blended percentage cut rarely matches what a file produces.
More still comes off the $24,000. Unpaid medical balances, deductibles, litigation costs, and an attorney fee sit outside the lien row. An estimate that stops at gross damages is an advertisement, not a budget you can plan around.
Zero is a real outcome too. A Senate Banking Committee summary of Wall Street Journal analysis reported that insurers closed 45% of auto liability and medical claims without payment, up from about 35% a decade earlier. The same summary cites National Safety Council estimates for 2024 putting the average economic cost at about $28,000 per injured person, about $45,000 for a clearly evident injury, and $174,000 for a disabling injury. Those are cost estimates, not promised settlements. Delayed symptoms, thin records, a causation fight, or a treatment gap can still produce no payment while the bills are real.
Compare any offer with the net layer. The $60,000 figure is not the number that shows up in your account.
Check Your Numbers Before You Accept an Offer
An offer letter usually puts one large number at the top. Before you treat that number as the answer, test it against the net estimate, the release language, and the records that are still open. Use these checks to keep the comparison in layers, so a gross figure cannot hide the costs that follow it.
Match the offer to the net estimate. Put the offer beside the net range, not the gross range. Note whether it lands inside, above, or below. A number that looks close to the gross estimate can still leave a wide gap once fault, policy limits, and liens are applied.
List what the release closes. Read the release for future medical care, future wage loss, and any claim for a condition that is still being treated. Once you sign, reopening the claim because a later surgery costs more may not be available, especially if the release waives that right. If the release is unclear on that point, ask before signing.
Name every lien and reimbursement claim. Health plans, hospitals, and sometimes Medicare or Medicaid want repayment from the settlement. Get those letters into the file before money changes hands. Otherwise you can owe a balance you thought the settlement covered.
Recheck gaps, delayed symptoms, and maximum medical improvement. If you are still treating, or pain appeared weeks after the crash, the medical record is not finished. Settling on a partial chart locks in a partial number. Wait for a stable diagnosis or a clear treatment plan before you treat the offer as final.
Use a free Accident Claim Value Assessment. It reviews the facts that can affect how a claim is handled and gives immediate guidance, with no contact details required. Use the guidance to see whether the offer's logic matches the facts you entered.
Ask for a closer look when the offer is far under the net, or future care is still open. A short guided quiz walks through plain questions, helps you see whether you may have a legal case, and can connect you with an attorney in the network who handles that kind of claim. For the negotiation itself, these strategies for an insurance settlement are a useful checklist before you reply to the adjuster.
The estimate is a tool for better questions. It is not a verdict, and a signed release is not something you can undo.
AskLegally helps people sort accident claims before they hire a lawyer, including how a calculator range shrinks once fault, coverage, and liens are applied. You can review the facts that affect your claim, with practical guidance and no pressure to share contact details up front. Visit AskLegally to start with the free claim tools and see what to do next.