
You're staring at a number on your screen after a crash, maybe $48,000, and trying to decide whether it's a lifeline or a mirage. The car accident settlement calculator gave you something that looks precise, but your bills, your pain, and your insurer's attitude don't feel precise at all. That tension is exactly where a good calculator helps, and where a bad one misleads.
A car accident settlement calculator should be treated like a rough map, not a promise. It can help you organize medical bills, missed wages, property damage, and pain and suffering into a range, but it can't see every injury, every policy limit, or every fact dispute. If your neck is still flaring up, a practical medical resource such as non-surgical neck pain relief options can help you understand why early symptoms and later treatment often don't line up neatly with a first estimate.
What a Car Accident Settlement Calculator Really Shows You
That $48,000 number on the screen feels concrete, but it's usually just the result of a few assumptions stacked together. A calculator asks for inputs, makes general choices about injury severity and fault, and then returns a range that looks more certain than it really is.
What the output actually means
A credible calculator does three honest things. First, it separates economic damages from non-economic damages. Second, it gives you a range instead of pretending one exact number can fit every case. Third, it warns you that the output still needs verification against medical records, wage proof, policy limits, liability evidence, and state law.
That matters because two people can enter similar bills and end up with very different claim values. One person may have a soft-tissue injury that resolves fully, while another may have lasting impairment, future care, and a much longer recovery path. A useful calculator helps you think through those differences, not erase them.
Practical rule: if the tool doesn't show what it counts, what it leaves out, and what assumptions it's making, the number is mostly decorative.
For a plain-language walkthrough of how pain and suffering is usually approached, this discussion on pain and suffering calculation is a useful companion. The point isn't to chase a perfect figure. It's to understand what the calculator is really telling you before you act on it.
The Two Buckets Every Calculator Separates
A settlement calculator usually sorts a claim the same way a ledger does. One side lists the losses you can count. The other side covers the harm that does not come with a receipt.
Economic damages are the receipt
Economic damages are the measurable losses tied to the crash. They usually include past medical bills, projected future treatment, lost wages, reduced earning capacity, household services, vehicle damage, and out-of-pocket costs. These are the figures you can usually support with invoices, employer records, repair estimates, tax documents, and medical opinions.
A calculator that ignores these items is incomplete. NHTSA's crash-cost framework separates medical expenses, lost market and household productivity, legal and court costs, emergency services, insurance administration, property damage, congestion, and workplace losses into different categories. In its 2019 analysis of U.S. crashes, NHTSA estimated $30.9 billion in medical costs, $106.3 billion in lost productivity, and $115.3 billion in property damage. Those are societal totals, not a personal claim value, but they show why a single bill total never captures the whole loss.
Non-economic damages are the experience
Non-economic damages cover the human side of the injury. That includes pain and suffering, emotional distress, loss of consortium, and reduced quality of life. There is no receipt for poor sleep, fear of driving, or the way an injury changes how you work, parent, or move through the day.
NHTSA estimated that U.S. motor-vehicle crashes generated about $340 billion in economic costs in 2019, and about $1.4 trillion when quality-of-life losses such as pain, disability, and loss of remaining lifespan were included (NHTSA societal harm estimate). That gap is the clearest reason a calculator cannot stop at medical bills.
If a tool does not separate these two buckets, it is oversimplifying the claim.
The Inputs That Drive Your Settlement Number
A calculator is only as reliable as the records behind it. Enter rough guesses where documents should be, and the result becomes a tidy estimate with weak support.
What to gather before you trust the result
Medical bills should come from itemized statements, imaging reports, therapy invoices, and any future care estimate from a treating provider. Insurers will look for treatment gaps, unrelated diagnoses, and whether the care was medically necessary or just repeated.
Lost income needs employer letters, pay stubs, time-off records, and, if needed, tax documents. The other side will usually test whether the missed time was tied to the crash or whether the wage loss was partial, intermittent, or overstated.
Property damage usually comes from a repair estimate or, if the car is totaled, an actual cash value assessment. Expect the insurer to compare repair photos, the vehicle's pre-crash condition, and any prior damage.
Liability evidence includes the police report, scene photos, witness statements, and any video or lane-position evidence you have. The insurer's main question is simple, who caused this, and how certain is the proof?
Policy coverage matters just as much as the injury itself. You'll want the per-person and per-accident bodily-injury limits on the at-fault policy, plus your own uninsured or underinsured motorist coverage if it exists. A calculator that does not ask about limits is missing the ceiling.
Comparative fault is the last major input. If the insurer thinks you helped cause the crash, it will use that to reduce the claim value. Even a strong injury claim can shrink quickly if fault is disputed.
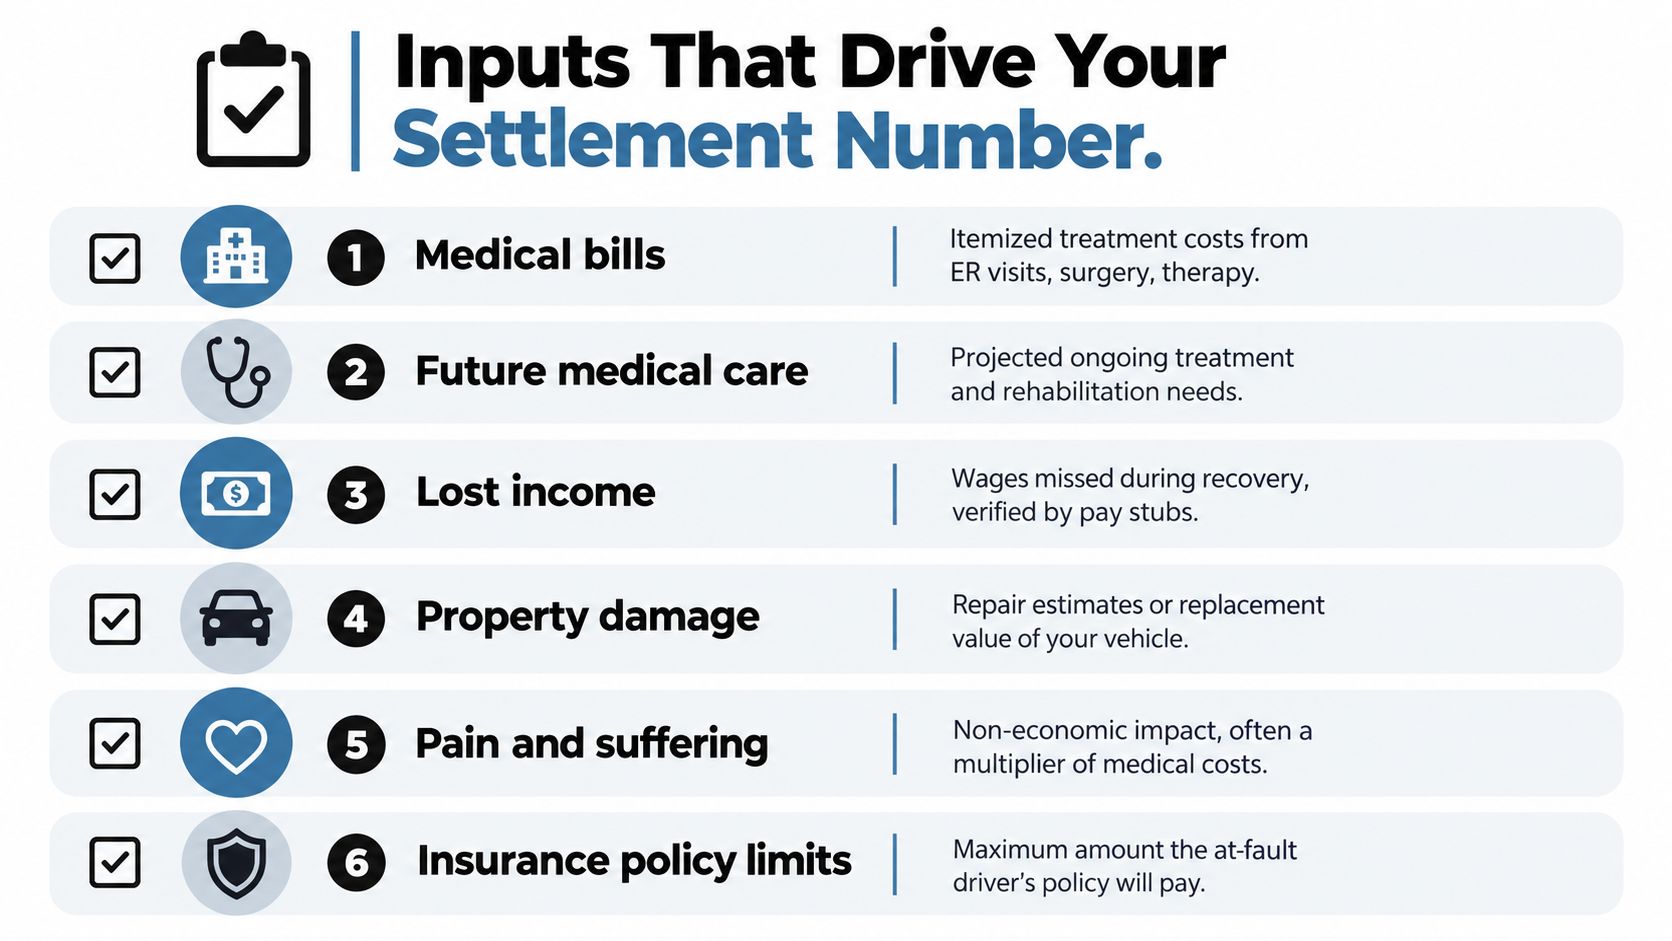
Six inputs, six paper trails. A calculator that skips any of them is guessing.
Bring records, not estimates, if you want the calculator to mean anything.
How Calculators Turn Inputs Into a Dollar Range
A calculator usually starts with the same basic ingredients, medical bills, lost income, property damage, and then turns pain and suffering into a value range. The process is less like arithmetic on a receipt and more like grading the full claim file.
The multiplier idea, and why it's only a shortcut
Many calculators use a multiplier method, where the non-economic part of a claim is tied to medical bills. Insurance Research Council analysis of more than 7.4 million U.S. auto-injury claims found that bodily-injury claimants received about $2.00 in total settlement, excluding legal fees, for every $1.00 of medical bills paid, and the ratio rose from roughly $1.80 in mid-2017 to more than $2.30 by mid-2022 (IRC auto-injury analysis). That gives a useful reference point, but it is still only a shortcut.
A soft-tissue claim that settles quickly does not behave like a claim involving a herniated disc, injections, or lasting limits on daily life. Using one multiplier for both treats treatment cost and real-world impact as if they always move together. They do not.
Low, central, and high scenarios are safer
A better calculator builds a range. Low means the injury heals cleanly and the claim stays near the hard costs. Central means the recovery is real, but the disputes are manageable. High means treatment expands, symptoms linger, or function does not fully return.
| Scenario | Multipliers on medical specials | Estimated total range |
|---|---|---|
| Soft-tissue, full recovery | Lower range | Closer to hard costs plus modest pain and suffering |
| Soft-tissue, lingering symptoms | Middle range | Higher than bills alone, with added non-economic value |
| Herniated disc, ongoing injections | Higher range | Wider range because future care and limits matter more |
A simple example helps. If medical bills are $12,000, missed work lasts six weeks at $800 per week, and property damage is $4,000, a fully resolved soft-tissue injury will usually support a different range than a herniated disc with ongoing injections. The dollars on the page stay the same, but the injury story changes the value.
A careful explanation of pain and suffering can help with that part of the math, and Lawyer in Martin County explains is a useful example of how that issue gets framed in plain language. For a wider look at how lawyers and calculators describe non-economic loss, see this guide to pain and suffering calculation.
The Cap Most Calculators Won't Tell You About
The number a calculator suggests and the number you can collect are often different. That gap is where people get caught off guard.

Policy limits can override the headline estimate
Bodily-injury policies usually have separate per-person and per-accident limits. A 50/100 policy means $50,000 for one injured person and $100,000 total for everyone hurt in the crash. If a calculator puts your damages at $90,000, but the policy is 50/100 and there are two injured claimants, the available money may be split in a way that leaves you far below the headline figure.
That is the blind spot in many online calculators. They estimate damages, not collectibility.
CCC data summarized by MoneyGeek shows why that cap matters. Bodily-injury claims made up 51% of auto-liability indemnity dollars in Q2 2025, even though they were tied to fewer than 25% of property-damage exposures, and the average third-party bodily-injury paid outcome reached $29,100 per injured party (CCC data summarized by MoneyGeek). That does not set your value, but it shows how quickly bodily-injury claims can run into policy limits and multi-claimant splits.
Ask these three questions before you rely on the number
- What are the at-fault driver's limits? If the policy is small, your damages may be higher than the insurer can pay.
- Do I have underinsured motorist coverage? Your own policy may fill part of the gap.
- Is there another defendant? A second responsible party can change the recovery picture entirely.
The headline number helps only if you know the cap. Without that, you are looking at damages, not recovery.
Why Timing Can Reshape the Estimate Too
A claim can look small because it's too early. That's a common mistake, especially when symptoms haven't fully declared themselves.
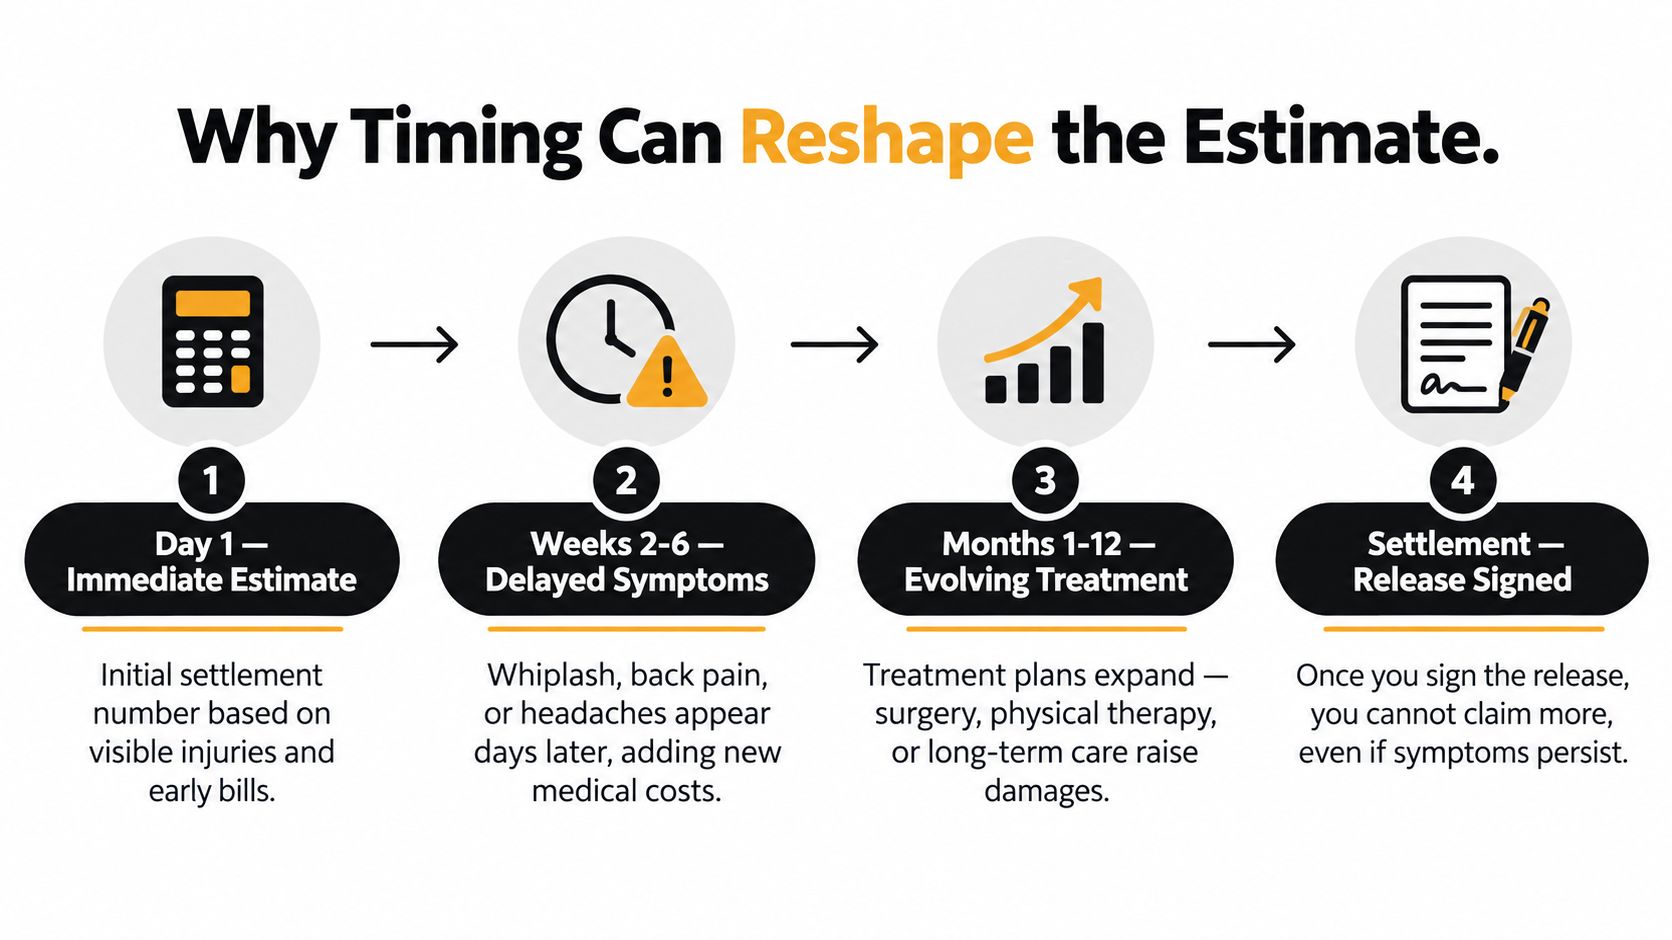
Early numbers miss delayed losses
Whiplash, back pain, headaches, and soft-tissue problems often show up after the first shock has passed. A calculator that only rewards current bills will miss future therapy, later imaging, specialist opinions, and work time that hasn't happened yet.
Irish national claims data gives a useful timing caution. It shows that 88% of motor-insurance claimants settled within 12 months of reporting and 94% within 24 months, but approximately 7,800 injury claimants in H1 2025 settled without receiving a compensation award (Central Bank of Ireland claims data). That doesn't prove underpayment, but it does show how claims can close before the full picture is clear.
Don't lock in before the medical picture settles
If treatment is still changing, the estimate should stay flexible. Once you sign a release, the claim is usually done, even if symptoms continue or new care becomes necessary. That's why a cautious calculator should separate current losses from projected losses and flag unresolved symptoms.
For a plain-language look at claim timing, AskLegally's settlement timeline guidance fits naturally with this issue. The key is to wait until imaging, specialist opinions, and your doctor's view of permanent restrictions or future care are on the record.
Using a Car Accident Settlement Calculator Safely
A calculator helps only when you treat it as a filter, not a verdict. Use it to organize the facts, then test whether an insurer's offer still makes sense once the full claim picture is in view.
A simple safety routine
- Separate the buckets. Make sure the tool distinguishes economic damages from non-economic damages.
- Use itemized numbers. Enter actual bills, wage proof, and repair estimates instead of rough guesses.
- Compare against known benchmarks. Check whether the result makes sense next to the $2.00-per-dollar medical-bill ratio and the $29,100 average third-party bodily-injury paid outcome covered above.
- Test the policy ceiling. If the output is higher than the available coverage, the practical recovery may be lower.
- Keep the number as a range. A planning estimate is useful. A pretend certainty is not.
Do not sign a release because a calculator made the number look fair.
Do not enter personal identifiers into a random tool, and do not treat a single result as a settlement offer. If fault is disputed, treatment is ongoing, or the insurer is pushing hard, it is smarter to move from calculator mode to claim review mode. Represented claims take longer to close for a reason, these cases often need more than a quick estimate.
What to Do After You Have a Number
Once you have a range, keep it simple. Gather your medical bills, wage records, policy information, and repair estimates. Then compare the calculator's output with the coverage available and the timing of your treatment.
If the issue is just a straightforward property-damage claim, the process may stay manageable. If there are questions about causation, future care, liens, or how much of the bill will survive after reimbursement, the number alone won't answer them. A useful resource on medical lien impact on settlement can help you understand why the gross number and the net number may not match.
For people who want help negotiating with an insurer, AskLegally's settlement negotiation guidance fits well with this stage. The goal of a car accident settlement calculator isn't to produce the settlement, it's to produce better questions before you agree to one.
If you're trying to make sense of your crash claim, AskLegally can help you organize the facts, understand what affects value, and decide whether your situation is simple enough to handle or complex enough to review with a lawyer. Visit AskLegally to get a free case review and start with a clearer view of your options.